4/7: 3D interactive graphics
Now that we have all of the structures rotated, superimposed, and grouped into a single '.rot' file, we are ready to visualize and manipulate the overlay in an interactive 3D environment. This task is controlled by a Python program over-lay.py, available here, which does the following:
- generates 'bonds' based on covalent radii
- sets bond colours
- sets atom colours
- writes an html file for viewing in a browser
- uses JavaScript to control the 3D graphics
- allows creation of high-resolution PNG images
The covalent radii used to configure the 'bonds' are held in a file named 'over-lay-atom-radii.json' in a sub-directory 'static'. Colour codes are stored in a file 'over-lay-bond-colours.json', also in 'static'. These colours are based on the 'tab20' colours from Matplotlib, but rearranged and brightened a bit (feel free to alter these to suit your tastes). The 'static' directory also has (slightly modified) CPK colours for atoms, an html template, css to format the browser interface, JavaScript to control the 3D viewer and copies of 3Dmol-min.js and html2canvas.min.js, i.e. these files:
- over-lay-atom-radii.json
- over-lay-bond-colours.json
- over-lay-cpk-colours.json
- over-lay-template.txt
- over-lay.css
- over-lay.js
- 3Dmol-min.js
- html2canvas.min.js
Local copies of 3Dmol-min.js and html2canvas.min.js are included here so that the programs can be run if internet access is unavailable. The above links, however, go to their proper repositories. These two files do all the heavy graphics lifting, with 3Dmol-min.js enabling the 3D interactive graphics rendering and html2canvas.min.js controlling high-resolution PNG image generation.
Over-lay.py looks for a file with '.rot' extension in the working directory and proceeds to generate the html file without further input. It should be almost instantaneous. The resulting html/JavaScript may then be loaded into any modern browser, giving something like this:
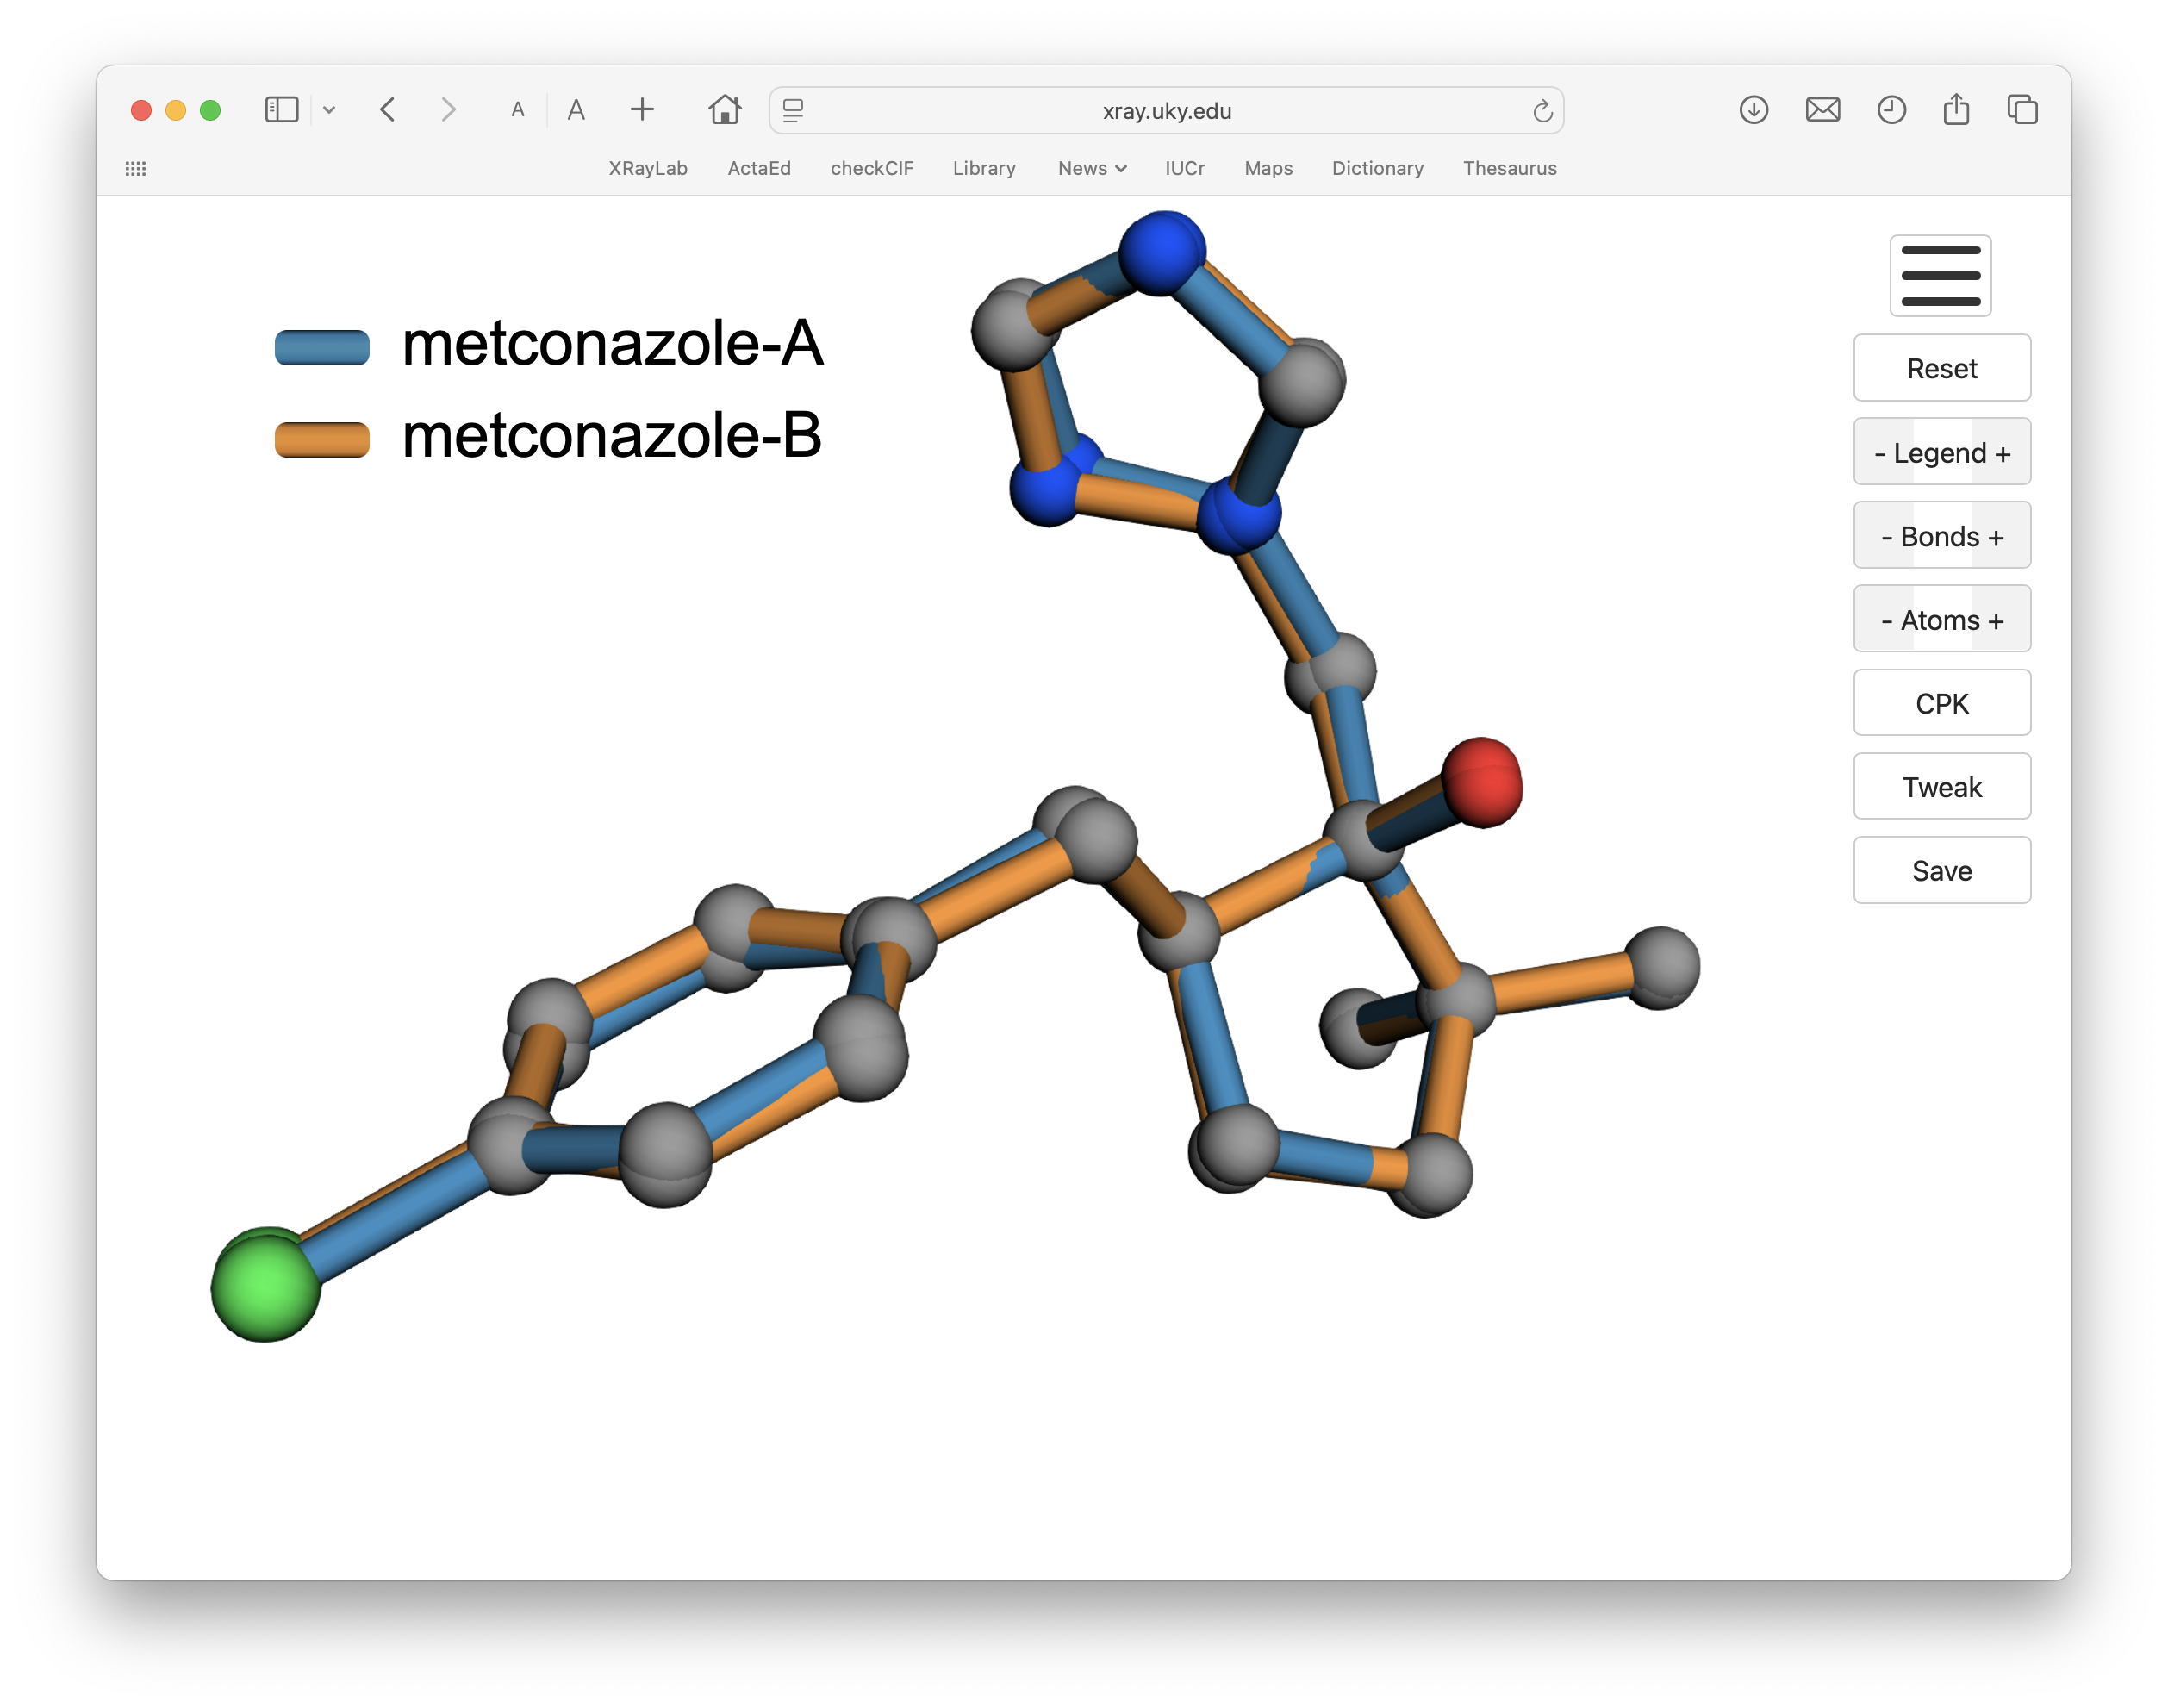
If you click on the above image, the 3D viewer should load in a separate page. Your mouse or trackpad rotates the view and zooms in/out. If viewed on a computer, the legend should be draggable (might not work on a phone) and can be made larger or smaller. Likewise, the bonds may be drawn wider or narrower, atoms can be toggled on/off and their colours changed, etc. The 'Tweak' button allows some fine tuning of the atom radii used for bond drawing, which can be useful for some long coordination bonds for which the default criteria are not sufficient. When you have a view that suits your purposes, clicking the 'Save' button temporarily hides the buttons, crops blank space around the scene, scales it to 5000 pixels wide, adds a 50 pixel border, and saves the image. The resulting PNG is big enough at 5100 pixels wide that it can be cropped or re-sized to satisfy most purposes.
That pretty much covers the basics, a few examples follow.
2: Extract atom coordinates from the CIF(s)
3: Optimal superposition via quaternions
4: 3D interactive graphics
5: Three tin complexes and their pro-ligand
6: Nine tin complexes
7: Seventeen arsenic complexes