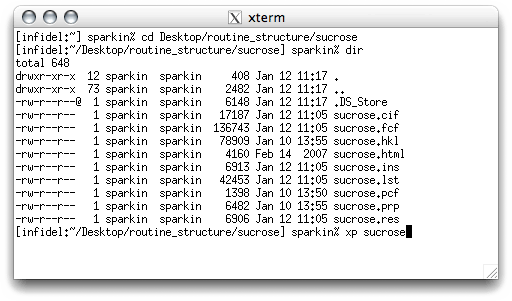
Start XP, and read in the final structure model for sucrose. You will need to
type the fmol command to generate a connectivity table etc. The .res
file includes all the difference map Q peaks, but we don't need them for drawing figures,
so get rid of them with kill $Q.
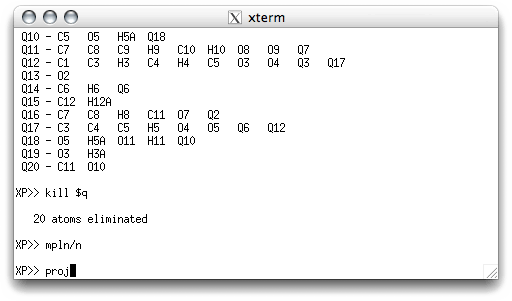
A reasonable starting orientation can often be found with mpln (or mpln/n),
so enter it, and then check the projection (proj).
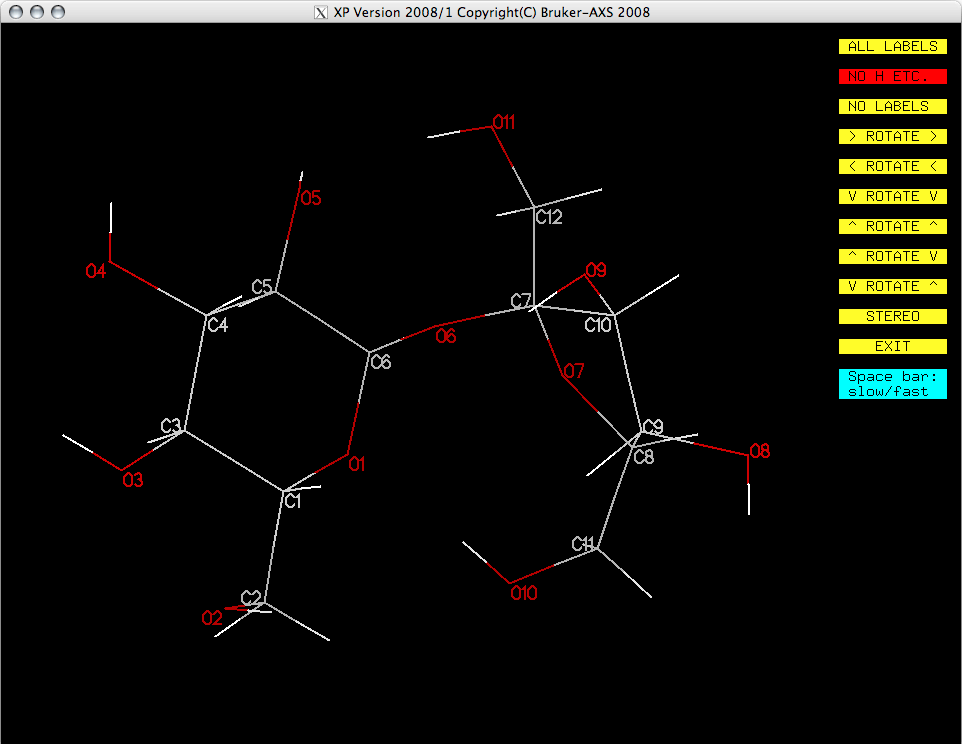
You may want to optimize the orientation to clearly show as many features of the molecule
as possible. Remember, you have to click the yellow buttons for this because dragging with
the mouse doesn't work in XP.
To draw an ellipsoid plot, you need to tell XP what style of ellipsoid you want. You could read the manual, but there is a handy help utility in XP that describes the commands. The command for changing atom types is ATYP, so if you type help atyp, you get a description of the options:
To draw an ellipsoid plot, you need to tell XP what style of ellipsoid you want. You could read the manual, but there is a handy help utility in XP that describes the commands. The command for changing atom types is ATYP, so if you type help atyp, you get a description of the options:
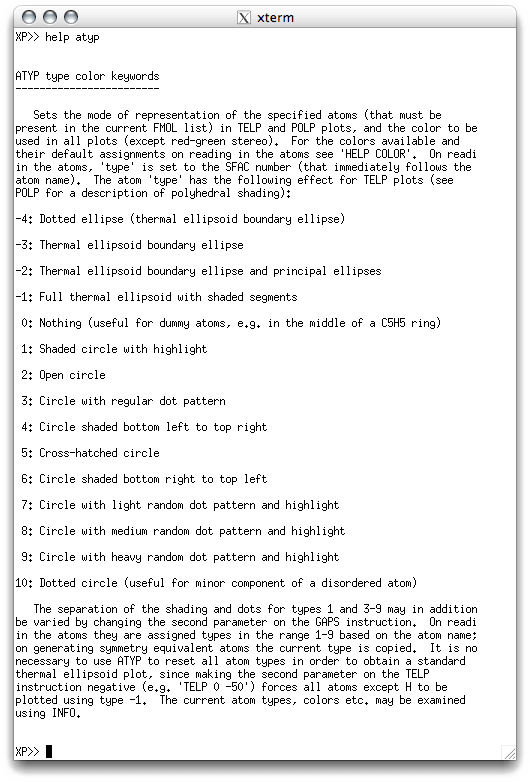
There's a lot of options. It is common practice to set carbon atoms to ATYP -2
(thermal ellipsoid with boundary ellipses), all the hydrogen atoms to ATYP 2
(open circles), and all the other atoms to ATYP -1 (full thermal ellipsoid with
shaded segment). You don't have to use those styles, but for simple structures, the
figures usually look better if you do. In the XP text window you enter the
commands like this:
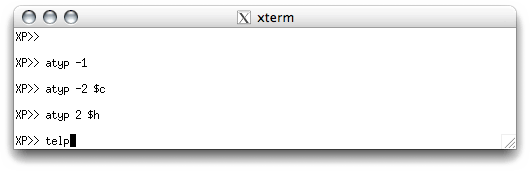
You can enter ATYP commands in a different order, or even atom by atom, but
entering them as in the above example minimizes the amount of typing you have to do.
If you want to see what your ellipsoid plot looks like, the command is TELP
(thermal ellipsoid plot). Since TELP creates a plot file, it needs to
know a filename. In this example, just enter sucrose.
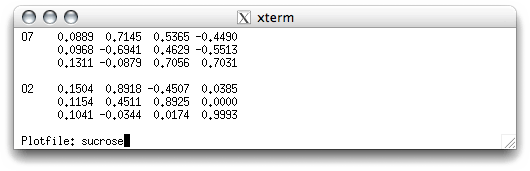
When you hit <return> an ellipsoid plot appears in the XP graphics
window:
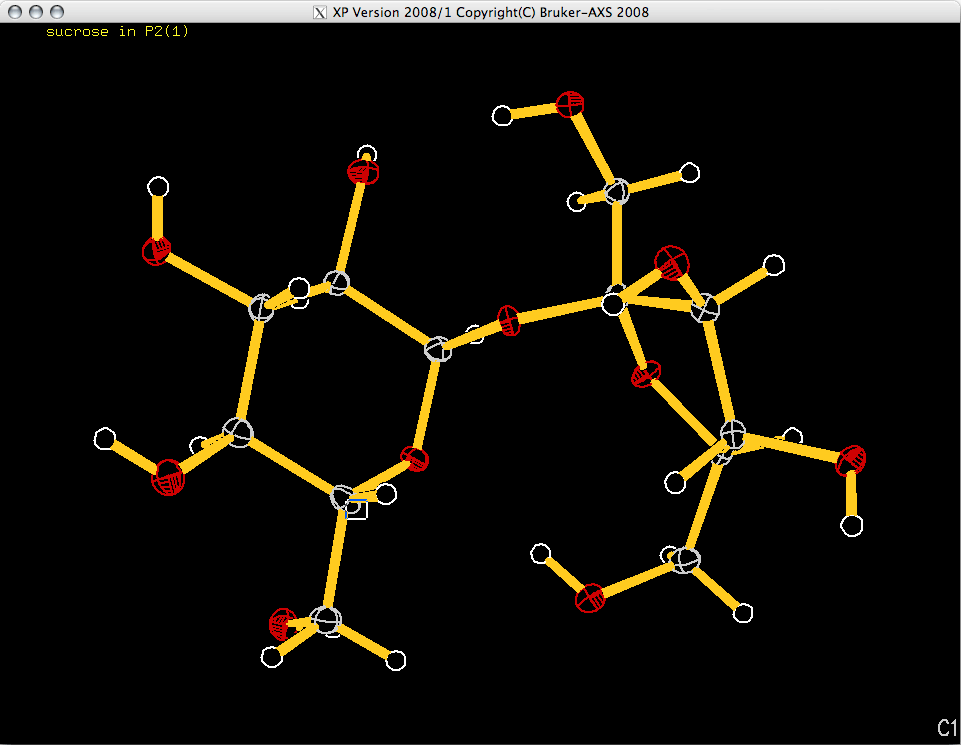
The orientation of the molecule in the image above could probably be improved (using
proj), but let's just go ahead and add atom labels. There is a command to change
the style of the labels (LABL - type help labl in the XP text
window for more details). The best option is LABL 1, which adds labels only to
the non-H atoms and the labels do not include parentheses. If you think the labels are
too big, you might try LABL 1 450 (help labl should explain all).
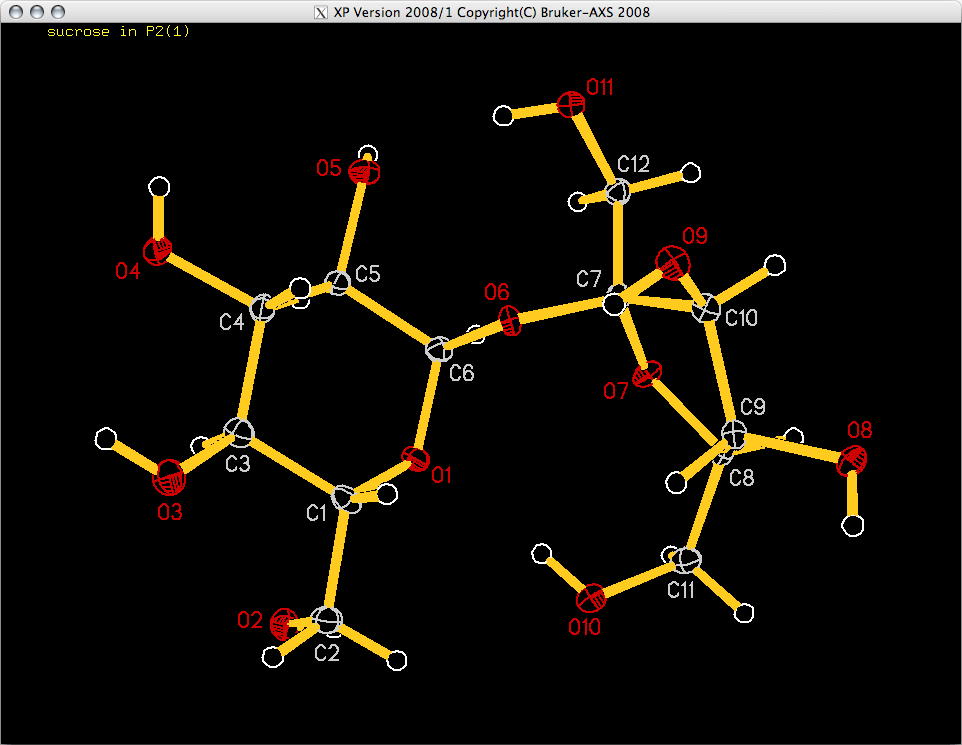
TELP shows you the atom it intends to label with a little white box, and the label to be added is shown in the bottom right corner. You need to move the box with the mouse or arrow keys so that it is not superimposed on any parts of the image, but is still closest to the atom in question. Once the box position is good, use the <space> bar to add the label and move on to the next atom. If you make a mistake you can step backwards with <backspace> (<delete> on a Mac), or you can skip past an atom with <return>. Go ahead and label all your atoms, which should give you something like this:
TELP shows you the atom it intends to label with a little white box, and the label to be added is shown in the bottom right corner. You need to move the box with the mouse or arrow keys so that it is not superimposed on any parts of the image, but is still closest to the atom in question. Once the box position is good, use the <space> bar to add the label and move on to the next atom. If you make a mistake you can step backwards with <backspace> (<delete> on a Mac), or you can skip past an atom with <return>. Go ahead and label all your atoms, which should give you something like this:
Once the ellipsoid plot is labelled, the <B> key will save the figure as
sucrose.plt in the same directory as all your other sucrose files. You can't
use the plot file directly because it is in a weird format, but you can VIEW
it in the XP graphics window (view sucrose). We'll use another >XP
command, DRAW, later to write out a postscript version of all the plot
files.
In addition to the standard ellipsoid plot, you will usually want to make packing diagrams. There are a few options available in XP for this, but this tutorial will only cover one method. You are encouraged to experiment with the various options, read the manual and use the help facility to find out more.
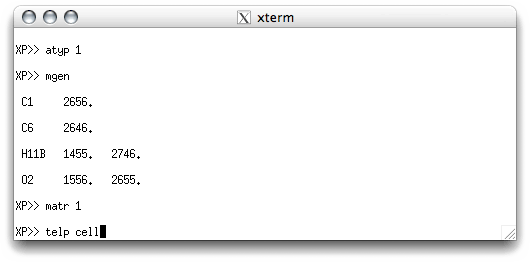
For a typical structure you will create views of the unit cell looking down each of the three axes, a, b, c. To do this you must first generate enough symmetry equivalent molecule fragments to show the packing. There is more than one way to do this (PACK, SGEN, MGEN), but we'll use MGEN. This is done in the XP text window. Packing plots usually look better without hydrogen atoms (kill $H), and with spheres or circles for the other atoms. In this case we'll use shaded arbitrary spheres (ATYP 1). We also need to orient the unit cell to look down each of the three axes (MATR). We'll start with the a axis, by typing 'matr 1' in the XP text window. You then use a special TELP command to draw a picture that includes the unit cell box (telp cell).
In addition to the standard ellipsoid plot, you will usually want to make packing diagrams. There are a few options available in XP for this, but this tutorial will only cover one method. You are encouraged to experiment with the various options, read the manual and use the help facility to find out more.
For a typical structure you will create views of the unit cell looking down each of the three axes, a, b, c. To do this you must first generate enough symmetry equivalent molecule fragments to show the packing. There is more than one way to do this (PACK, SGEN, MGEN), but we'll use MGEN. This is done in the XP text window. Packing plots usually look better without hydrogen atoms (kill $H), and with spheres or circles for the other atoms. In this case we'll use shaded arbitrary spheres (ATYP 1). We also need to orient the unit cell to look down each of the three axes (MATR). We'll start with the a axis, by typing 'matr 1' in the XP text window. You then use a special TELP command to draw a picture that includes the unit cell box (telp cell).
As before, TELP asks you for a file name. Something like sucrose_a would
be a good choice:
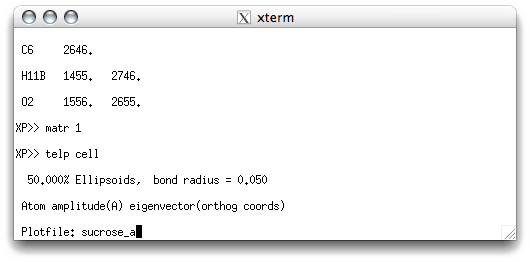
When you hit <return> you get this:
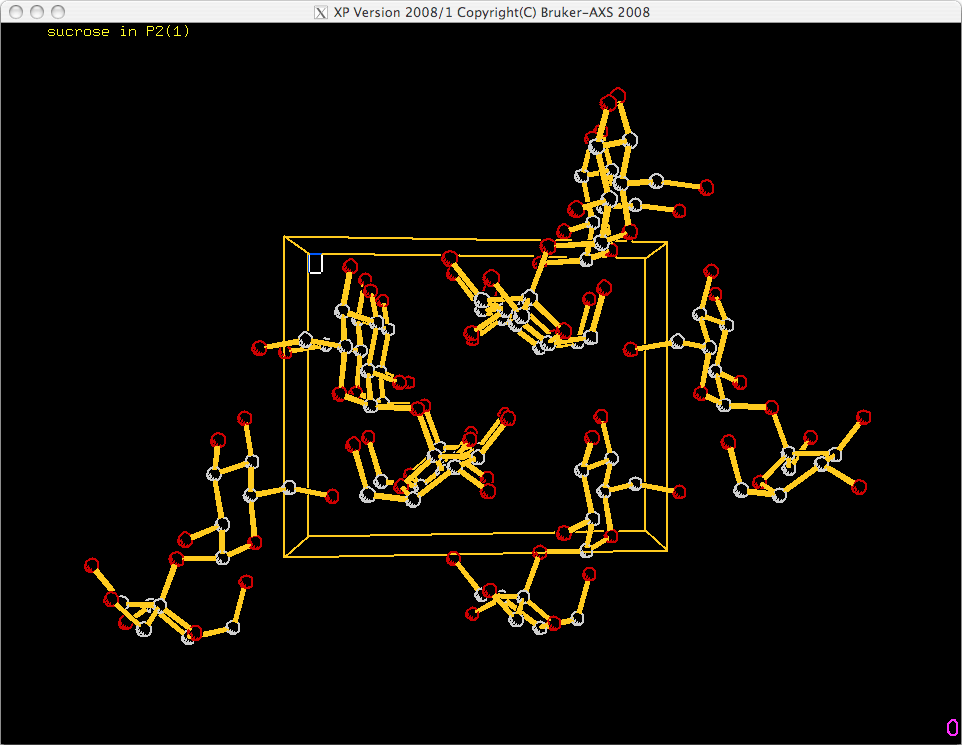
As with the ellipsoid plot, you need to add labels. Normally just the origin and axis
labels are needed. TELP is smart enough to know this, but you ought to position
the label box carefully so that the labels do not overlap parts of the drawing. XP
will suggest that you also label the atoms, but this is not necessary in most packing
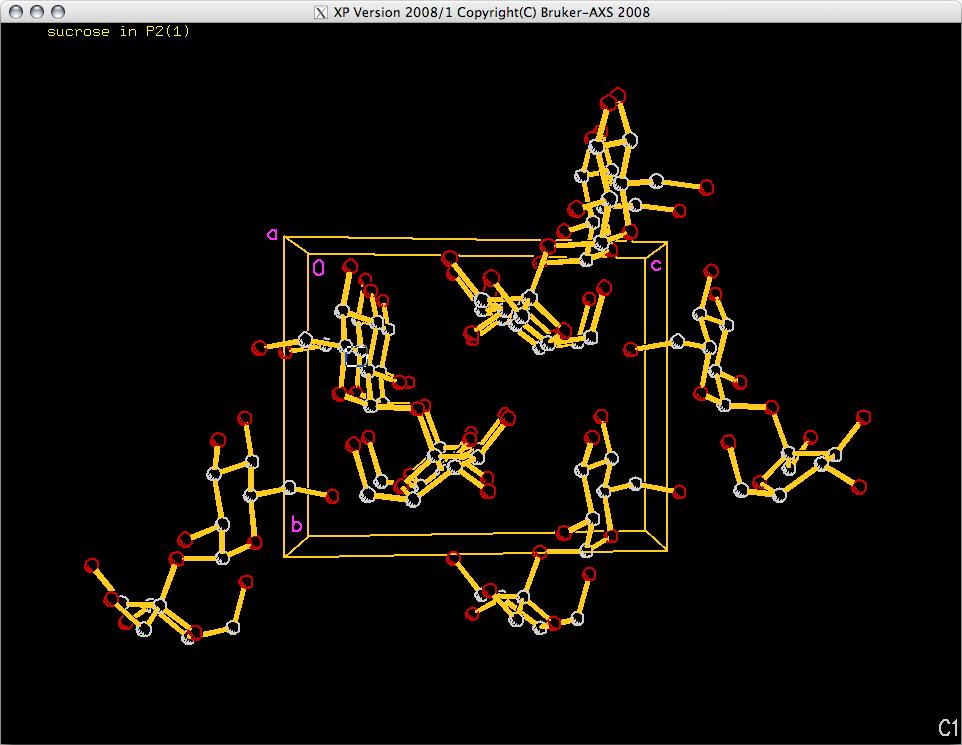
diagrams. When you have done the labelling you save the plot file by hitting the
<B> key. The plot down 'a' should look something like this:
Packing plots viewed down the b and c axes are done in exactly the same
way, but use 'matr 2' for the b axis and 'matr 3' for the c
axis. For structures with hydrogen bonds you may want to try adding dashed lines between
the H atom (or its donor) and the acceptor. There are two commands for adding extra
types of bonds (JOIN and LINK). Use the HELP command for more
information. You may also want to experiment with PACK because it is quite
different from MGEN, and you might prefer it.
When you have made all the plot files, they must be drawn. As stated above, the DRAW command is used (e.g. draw sucrose), like this:
When you have made all the plot files, they must be drawn. As stated above, the DRAW command is used (e.g. draw sucrose), like this:
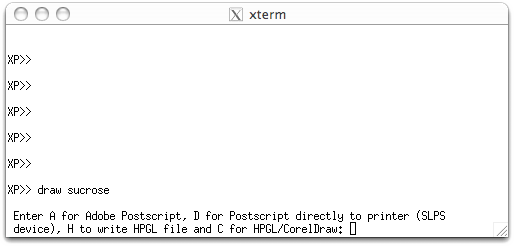
There are a few options here. 'A' for Adobe Postscript is probably the most useful
nowadays. The rest of the interaction with DRAW looks like this:
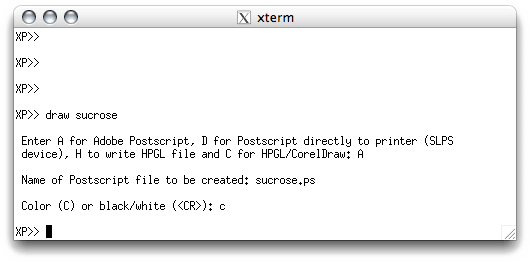
A postscript file has been created in the directory containing all your sucrose files.
To view such a file, click this file name sucrose.ps
You can DRAW the packing diagrams in the same way.
The computers in the UK X-ray lab. at UK have some other utilities that you might find useful. The postscript files output by XP have grey carbon atoms are a bit too light for some tastes. These can be made a bit darker using a script, ps2. You have to exit XP though because the script is run from the command line in an xterm window. All you have to do is type ps2 <return>, like this:
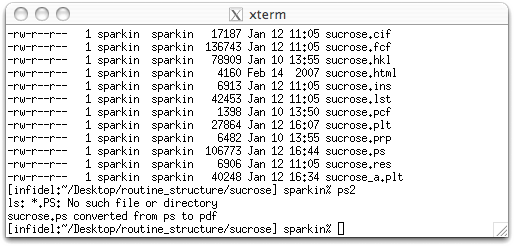
The xpdraw (or ps2) script looks for all files in the current directory that end with
.ps or .PS and fixes the colours in them. It also writes a .pdf
file for each, which in this case is sucrose.pdf.
Note that xpdraw is optional. Once you have all your diagrams drawn you are ready
to edit the CIF. Part 6 of this tutorial will show you one way to do this.
Part 1: Setting up instructions - XPREP
Part 2: Structure solution - SHELXS
Part 3: Molecule editing - XP
Part 4: Structure refinement - SHELXL
Part 5: Ellipsoid and packing plots - XP
Part 6: The Crystallographic Information File - CIF
Part 2: Structure solution - SHELXS
Part 3: Molecule editing - XP
Part 4: Structure refinement - SHELXL
Part 5: Ellipsoid and packing plots - XP
Part 6: The Crystallographic Information File - CIF
Return to the first page of this tutorial
Return to the main Tutorials page or to the main X-Ray Lab page
Return to the main Tutorials page or to the main X-Ray Lab page